What Are Infographics and Why Do You Need Them?
Infographics simply mean a visual or graphical representation of your information and date. It is a very simple and direct way to present your data, numbers, and message to your readers in a very short space.
It will be super easy for your readers to understand the outcome and the message you are trying to deliver. Infographics gained an increased popularity over the past couple of years and many bloggers and website owners started to include infographics in their posts to increase the reader’s engagement.
Why we need them:
Infographics can help you in many ways as mentioned below:
- Deliver and present your message, data, and numbers in a simple and clear way.
- Enrich your blog or website and increase reader engagement.
- Increase traffic to your blog or website. When you include infographics in your posts, readers will be more interested in visiting your blog and therefore your traffic will increase. Also, if you have your own message, data, and numbers that are worth sharing with other people then you can build your own infographics.
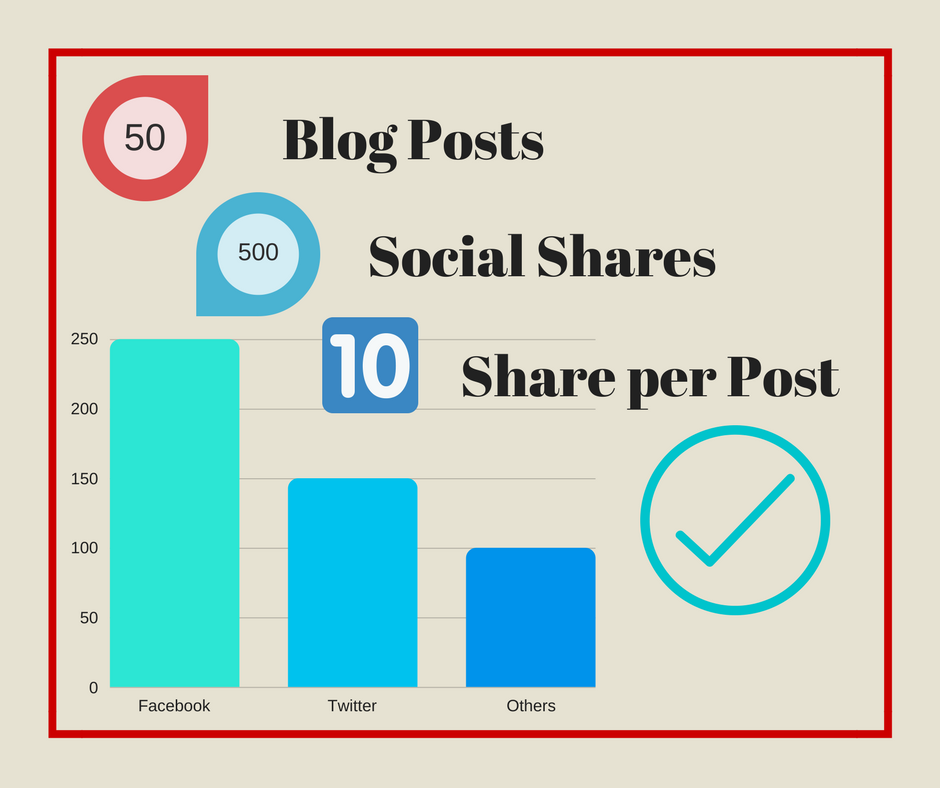
As listed in the infographics facts in below infographic, a visual representation of numbers and data is much easier to understand than reading a text including numbers and data. To demonstrate this let us say that you want to market your blog, you will write a post similar to the below:
“Our blog has 50 posts with a total of 500 social shares & post likes, each post receive an average of 10 social shares & post likes, which is more than the industry standard in our niche. The top social media being used to share our posts is Facebook with 250 shares followed by Twitter with 150 shares.”
This is a short example and in most cases, your post will have more numbers and sophisticated statistics. Your readers will need time to go through the numbers to understand it and understand what it means, in some cases where unfamiliar statistics is being presented to the reader, they might not understand if your performance is good or bad.
Now let us look at the same example but in a visual presentation, the same information is being presented in very limited space.
It is much easier for your readers to understand your numbers now. They will understand that Facebook is being the top social network with the most shares without having to tell your readers anything.
[amazon_link asins=’B00ZVOY89O’ template=’ProductCarousel’ store=’qtoptips-20′ marketplace=’US’ link_id=’70b086c4-5051-11e8-bba6-bbbd1c89f0c4′]
Infographics example:
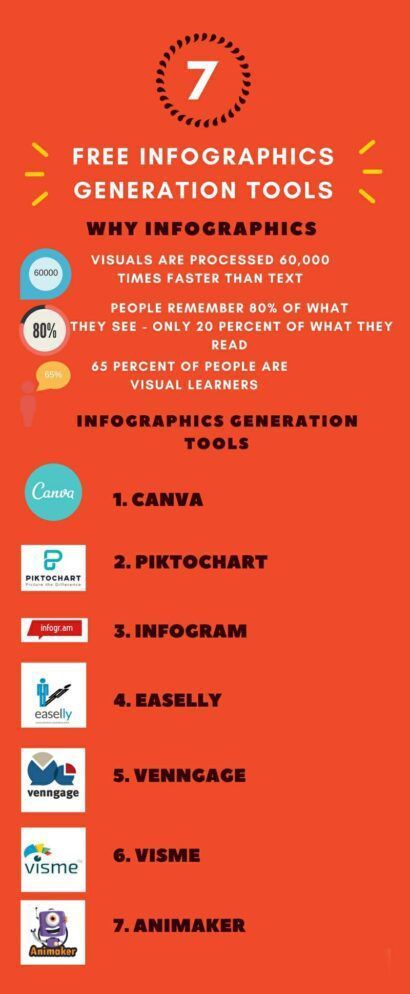
What a great example I would show you about infographics, other than an Infographic that I have prepared for this post using Canva tool. The infographic list some facts about infographics and then list the top 7 free infographics generation tools.
Can you build your own infographics? And how much will it cost?
Most bloggers share ready-made infographics but the question is can they build their own infographics? And the short answer is yes. If you have enough data or numbers about a specific topic then you can build your own infographics. The real question will be, how much it will cost?
In the early days, you will need to pay a professional designer to prepare an infographic for you, and it would be costly, therefore only big companies were using infographics to market their product and services. Nowadays there are a lot of available tools that you can use to build your own infographics for free or for very few dollars.
Top 7 Free Infographics Generation Tools Video
httpv://www.youtube.com/watch?v=ozgKsdaMl9M
Top 7 infographics generation tools that you can use for free.
Here is a list of the top 7 infographics generation tools that you can use today to create infographics for free. Some of these tools require paid account for advanced features.
1. Canva
100M+ Designs created 10M+ users
Canva is a great tool for creating infographics with the most easier to use & feature rich editor among our list. In addition to infographics, Canva can be used to create more than 40 different designs including book cover, logos, posters, presentations, social graphics, web ads, and many others. Each Main design will have sub-designs under it for more detailed designs. For example, under social graphics, you will find sub-designs like Facebook posts, Twitter posts, Youtube Thumbnails, etc which have customized size and design ready to be used on the respective social network directly.
The Canva editor is easy to use drag and drop editor and offer different elements that can be added to your design, including images, layouts, banners, and text designs, which can be used to create simple infographics. Most of those elements are free, but few of them are premium.
Once your design is ready you can click on publish and get a link where your design is published on Canva. You can also download your design as an Image or PDF for free if you are using the free elements. If you are using any premium element you will only need to pay 1$ for each element. Also, There is a default size limit for each design. For example, the size limit for Infographics is 800 x 2000. The size limit is only for free accounts, with a pro subscription you can resize your design to any size you want.
Canva has detailed tutorials to help you understand how to use the editor and become a professional designer. Canva also allows multiple members of a team to work on a single design, you can invite up to 10 members for free, your members can then join and start working on the same design.
Canva offers a paid account (Canva for Work) for companies starting from 12.95$ per team member per month. The paid account offers advanced features not available for free accounts such as branding (uploading your company logo and company design), uploading your own image, access to 400,000 free photos, illustrations & templates, and many more features.
This is my favorite tool among all, as it has many advanced features, allows you to create different designs, and helps teams to work on a single project easily. This is the only tool that provides teams with free accounts, all other tools require a paid account for team members to work on a single design.
httpv://www.youtube.com/watch?v=3-lB4Q-k1OI
2. Piktochart
24M+ Visuals Created 11M+ Users 748 Templates
Piktochart is one of the leading infographics generation tools in the industry. All you need to do is to create a free account, select a theme and start editing your theme. You can download your infographics as JPEG or PNG. This tool has some limitations for free accounts such as the number of themes available. You can use Piktochart to create infographics, presentations, reports, flyers, and posters.
Picktochart offers three paid accounts with additional features, Lite for 12.5$ per month, pro account for 24.17$ per month, and pro team account which starts from 43.33$ per month for two users or team members. The pro team account allows your team members to work on a single design and allows you to keep all your work in a single place.
For most users, the free version is more than enough – of course, if you are okay with Piktochart Watermark. If you need any help on how to create your infographics; Piktochart provides comprehensive videos and tutorials on their website.
httpv://www.youtube.com/watch?v=LdRMqJWyvik
3. Infogram
4.8 M+ Infographics created
Infogram is another leading infographics generation tool. It’s the only tool that provides you the capability to add a video to your infographic. It has an easy to use & sophisticated editor. As soon as you choose your theme you can start editing your infographic, add charts, images, and a Vimeo or YouTube videos.
The only problem with creating a free infographic with Infogram is that your infographics will be published and hosted on Infogram itself and with Infogram watermark. If you want to download your Infographic as PDF or PNG, or if you want to remove the Watermark, then you need to upgrade to a paid account. Also, with the free account, you are limited to 10 projects only with a maximum of 3 pages for each project.
Infogram offers different paid accounts starting from 19$ per month for pro account, each account level unlocks more advanced features which are not available with the previous account level. The team accounts start from 149$ per month for 3 team members.
httpv://www.youtube.com/watch?v=nnoy8TxJSHo
4. Easel.ly
Over 6M Infographics created 512 Premium templates
Easel.ly comes next on our list. It is the only 100% free to use on our list. You can select a pre-made infographic theme or start with a fresh page. Using drag and drop easy to use editor you can start working on your infographic. Once you are finished with the design you can save your infographic. You can then view your infographic on Easel.ly website or download it as a JPG for free.
httpv://www.youtube.com/watch?v=Q249nGdkVfs
5. Venngage
Next, we have Venngage. You can create an infographic from blank or use one of the many themes available in the marketplace (most of them are free but some are paid). You can add many charts and shapes, you can use images from the web or upload your own images. Once you save your infographic, it will be published and hosted on Venngage for free. You are limited to 5 infographics for free accounts.
To be able to download your infographic or to have your own branding you need to upgrade to premium account for 19$ per month for individuals or business account for 49$ per month for companies. For team members, you will need a business account.
httpv://www.youtube.com/watch?v=a4xOQXFddVU
6. Visme
Visme is still in beta. You can use Visme to create infographics from ready-made templates or adding different ready-made blocks like graphs, tables, maps, and many more to your infographic. You can save your content blocks to use them in future projects. Once your infographic is ready, you can share it online or you can download it as JPG or PNG. Visme can be used to create presentations, infographics, charts, and social graphics.
As a free account, you are limited to 3 projects, have limited storage, and have limited templates and charts available for you to use. You can upgrade your account to standard account for 10$ per month or complete account for 20$ per month to unlock additional features.
httpv://www.youtube.com/watch?v=TrXOsC4OzS8
7. Animaker
Animaker is an animated video creation tool that can be used to create a wide range of animated videos including explainer videos, Facebook videos, cartoon videos, advertisement videos and many more. Animaker can also be used to create video infographic which is 10 times better than normal infographic as stated on the website.
With the free account, you can create your video with any type mentioned above with 2 min maximum video length, your videos will be having Animaker watermark and have limited number of sound effects and music tracks. If you want to increase the length of your videos or have any additional features, you need to upgrade to a paid account.
Animaker has 3 plans starting at 12$ per month for personal accounts, 19$ per month for startup accounts, and 39$ per month for business accounts. Each upgrade increases your video length further and provides you with additional features.
The first video on this post is created by Animaker and it is a great way to use Animaker to market your blog and your blog posts.
httpv://www.youtube.com/watch?v=WqwqzJKa7u0
Final thoughts
There is a lot of online tools that can make your work easier. You should use these tools to create infographics and charts to represent your ideas more clear in your blog posts. Using infographics can help you liven up your blog.
Have you been using any infographics creation tool? What do you think of using infographics in your blog posts? Let me know in your comments.